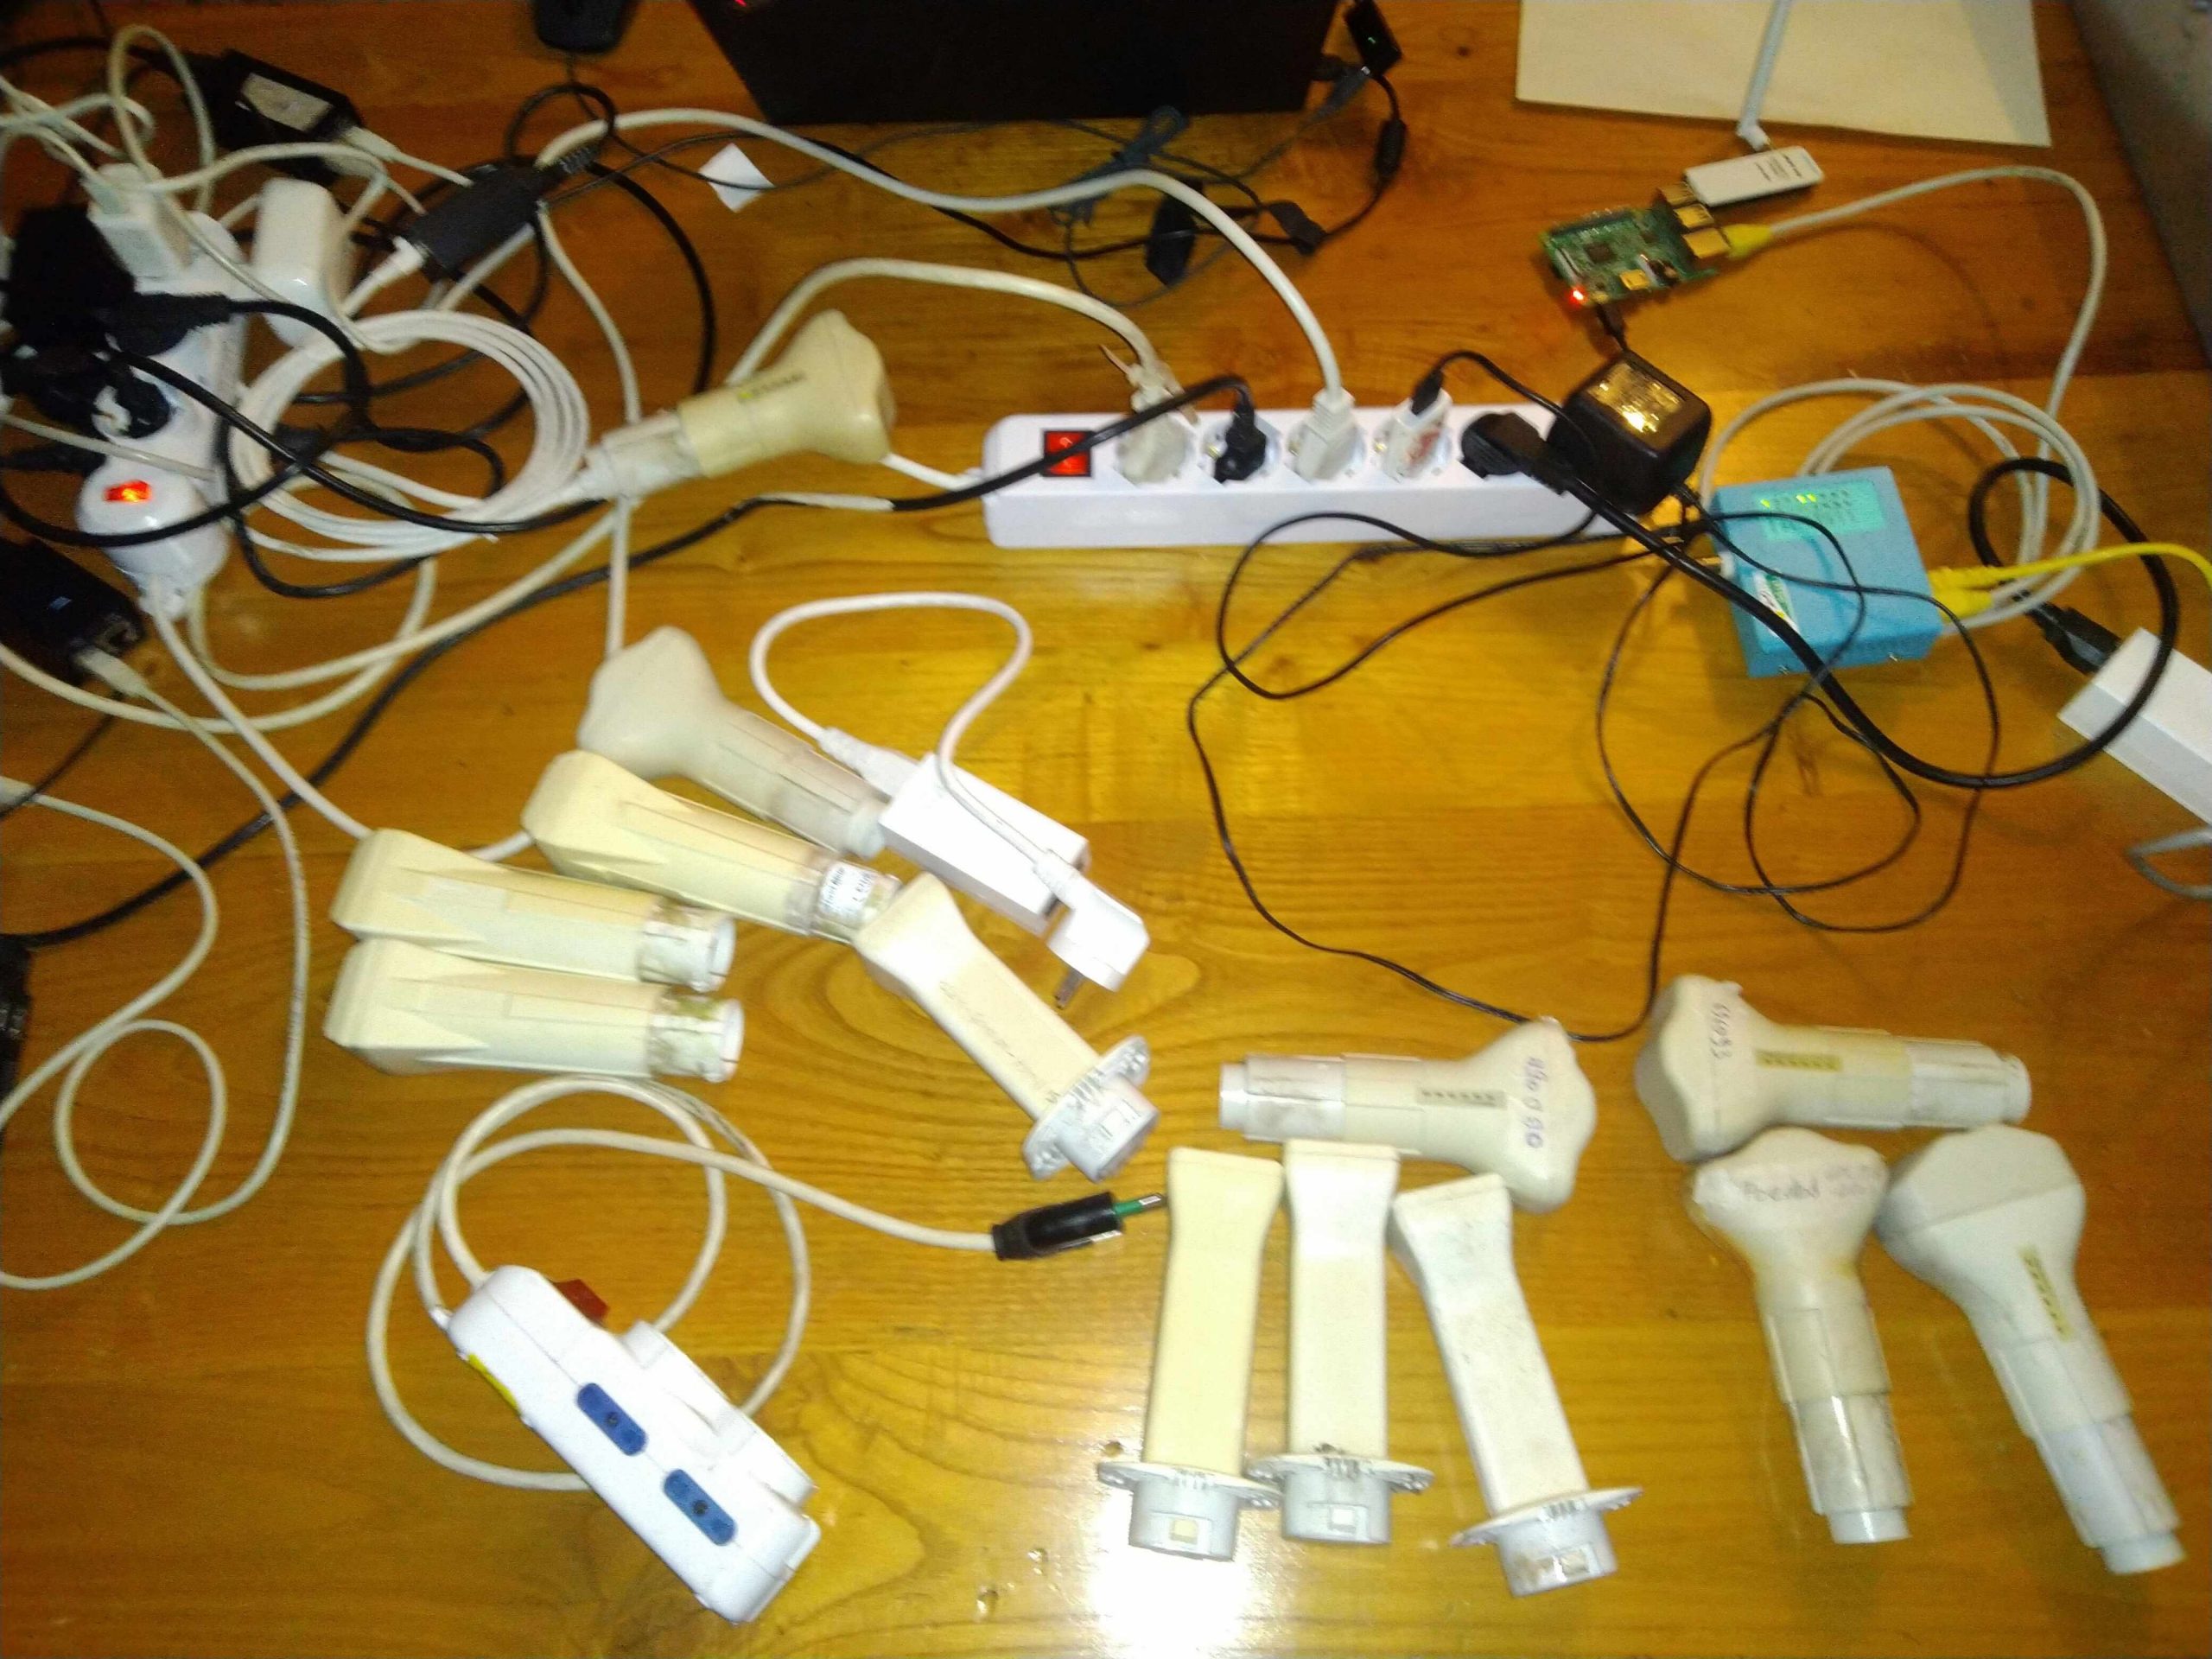
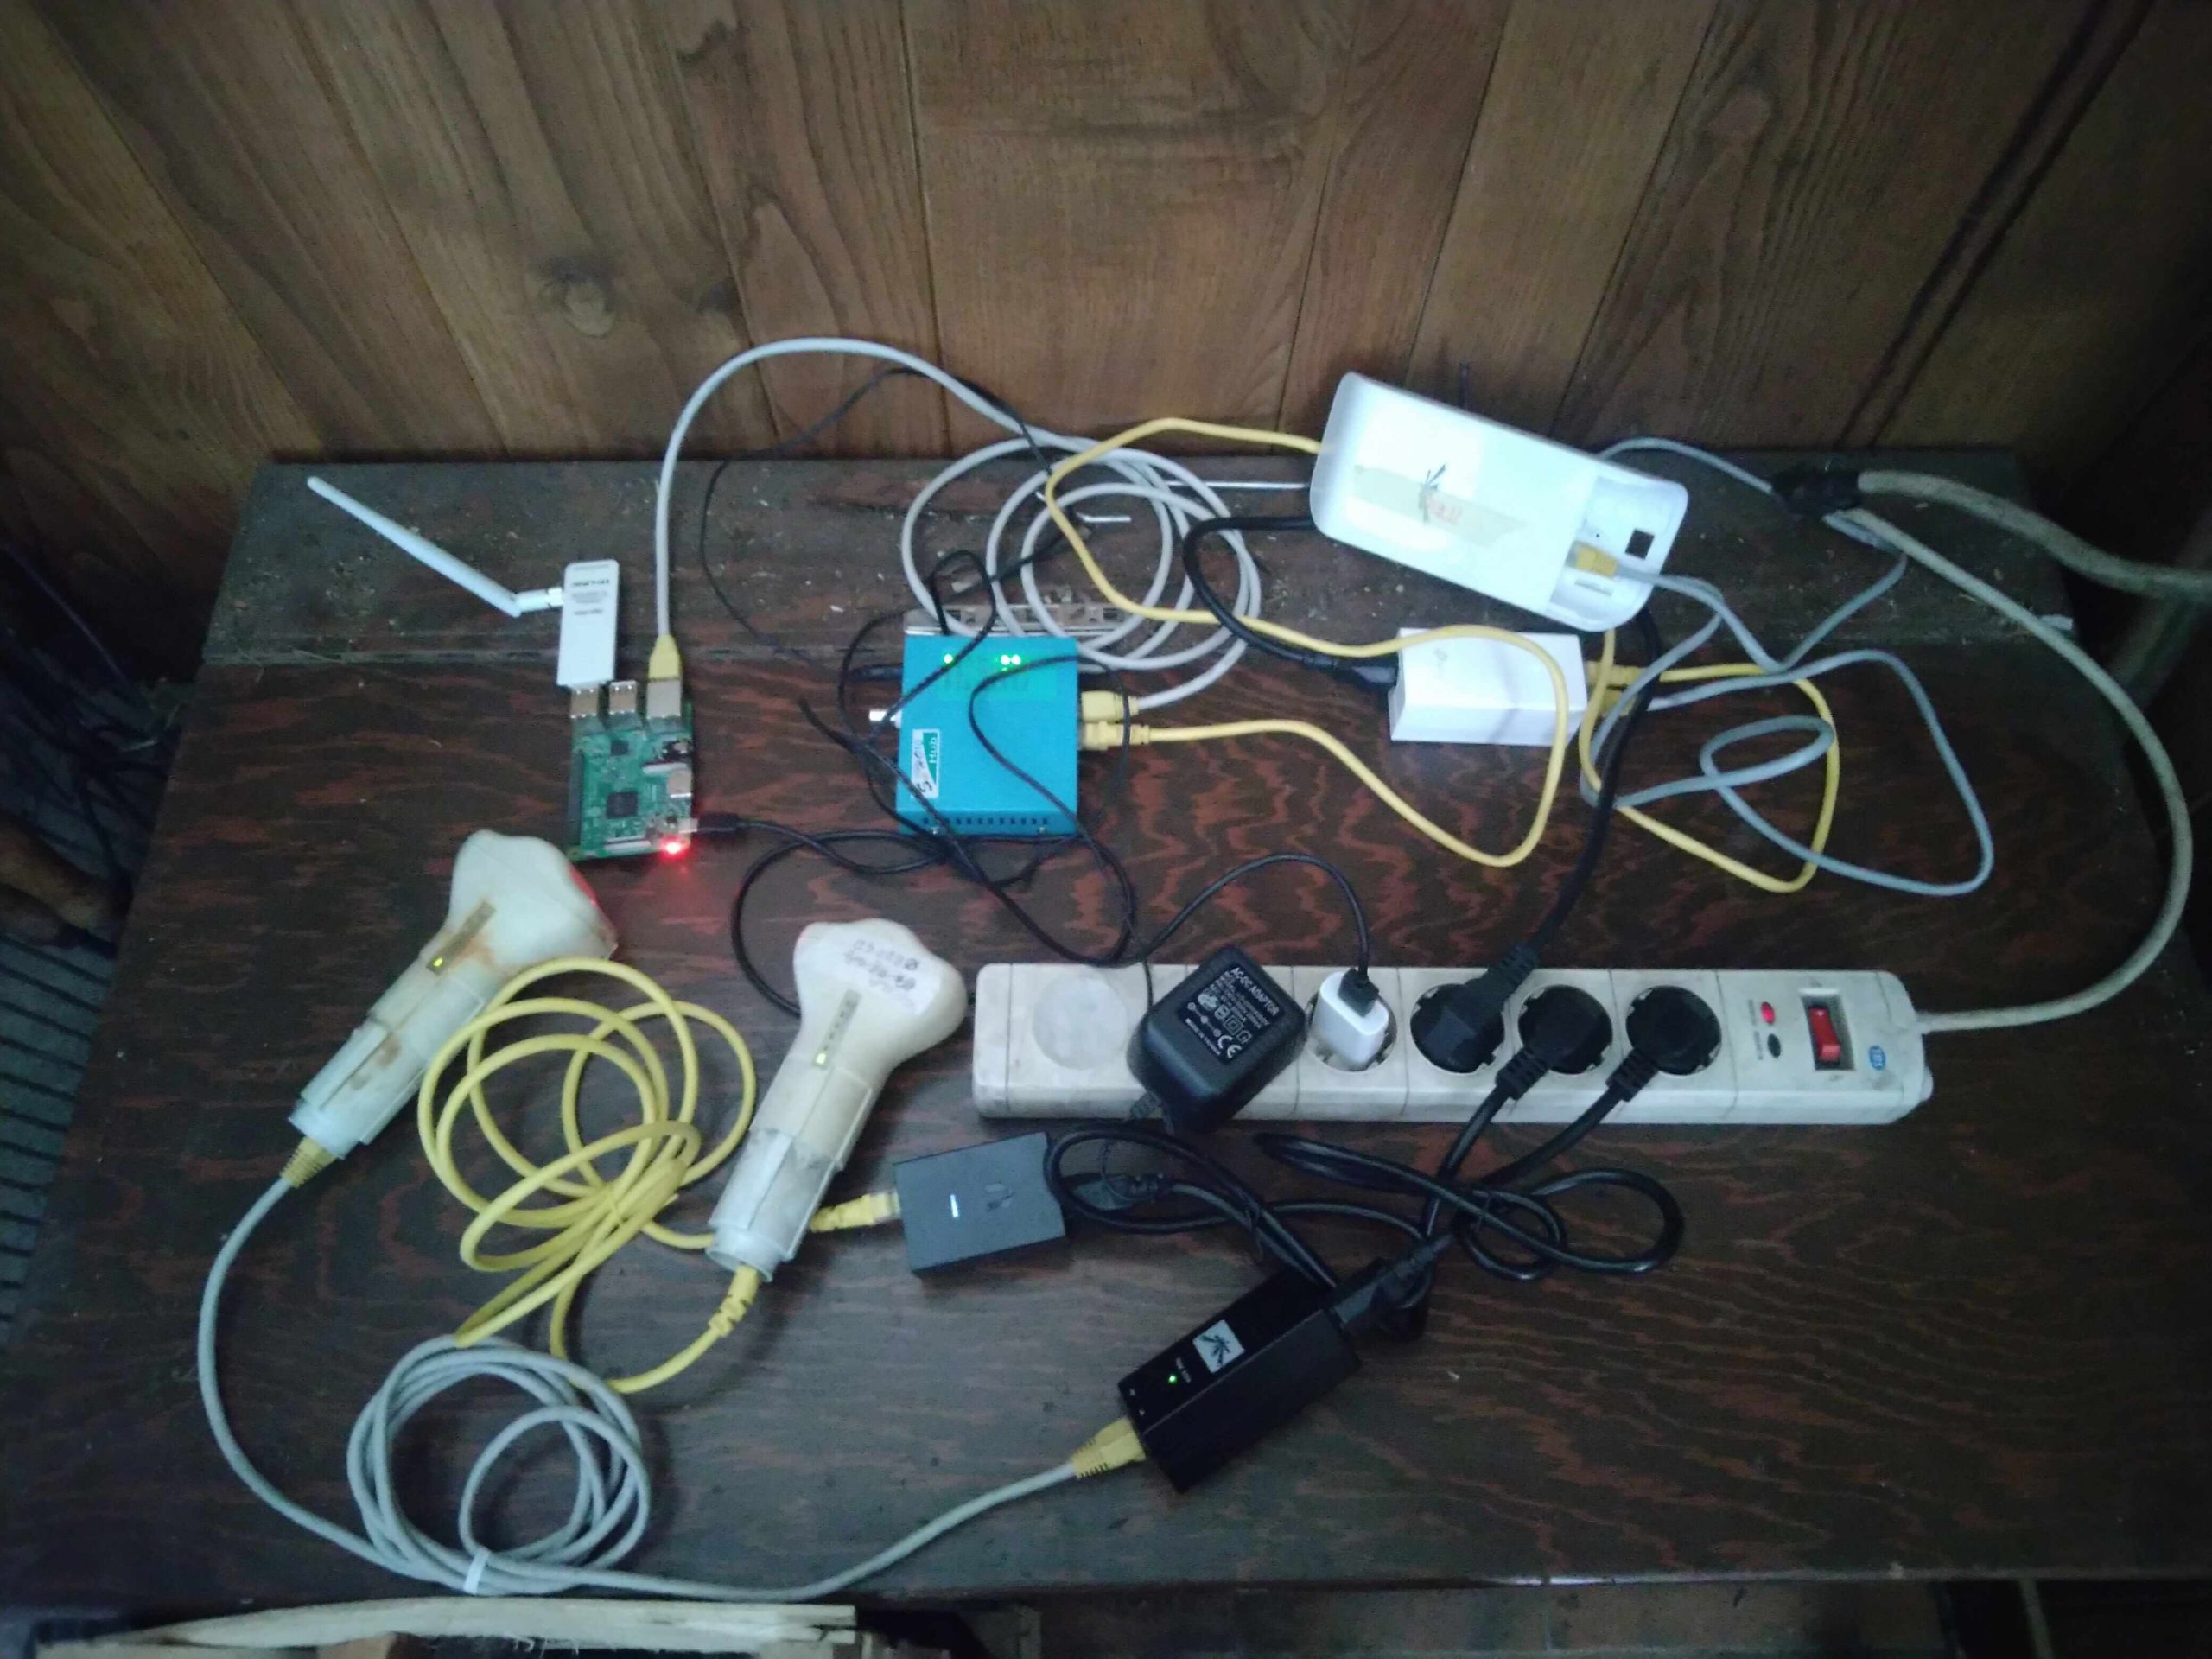
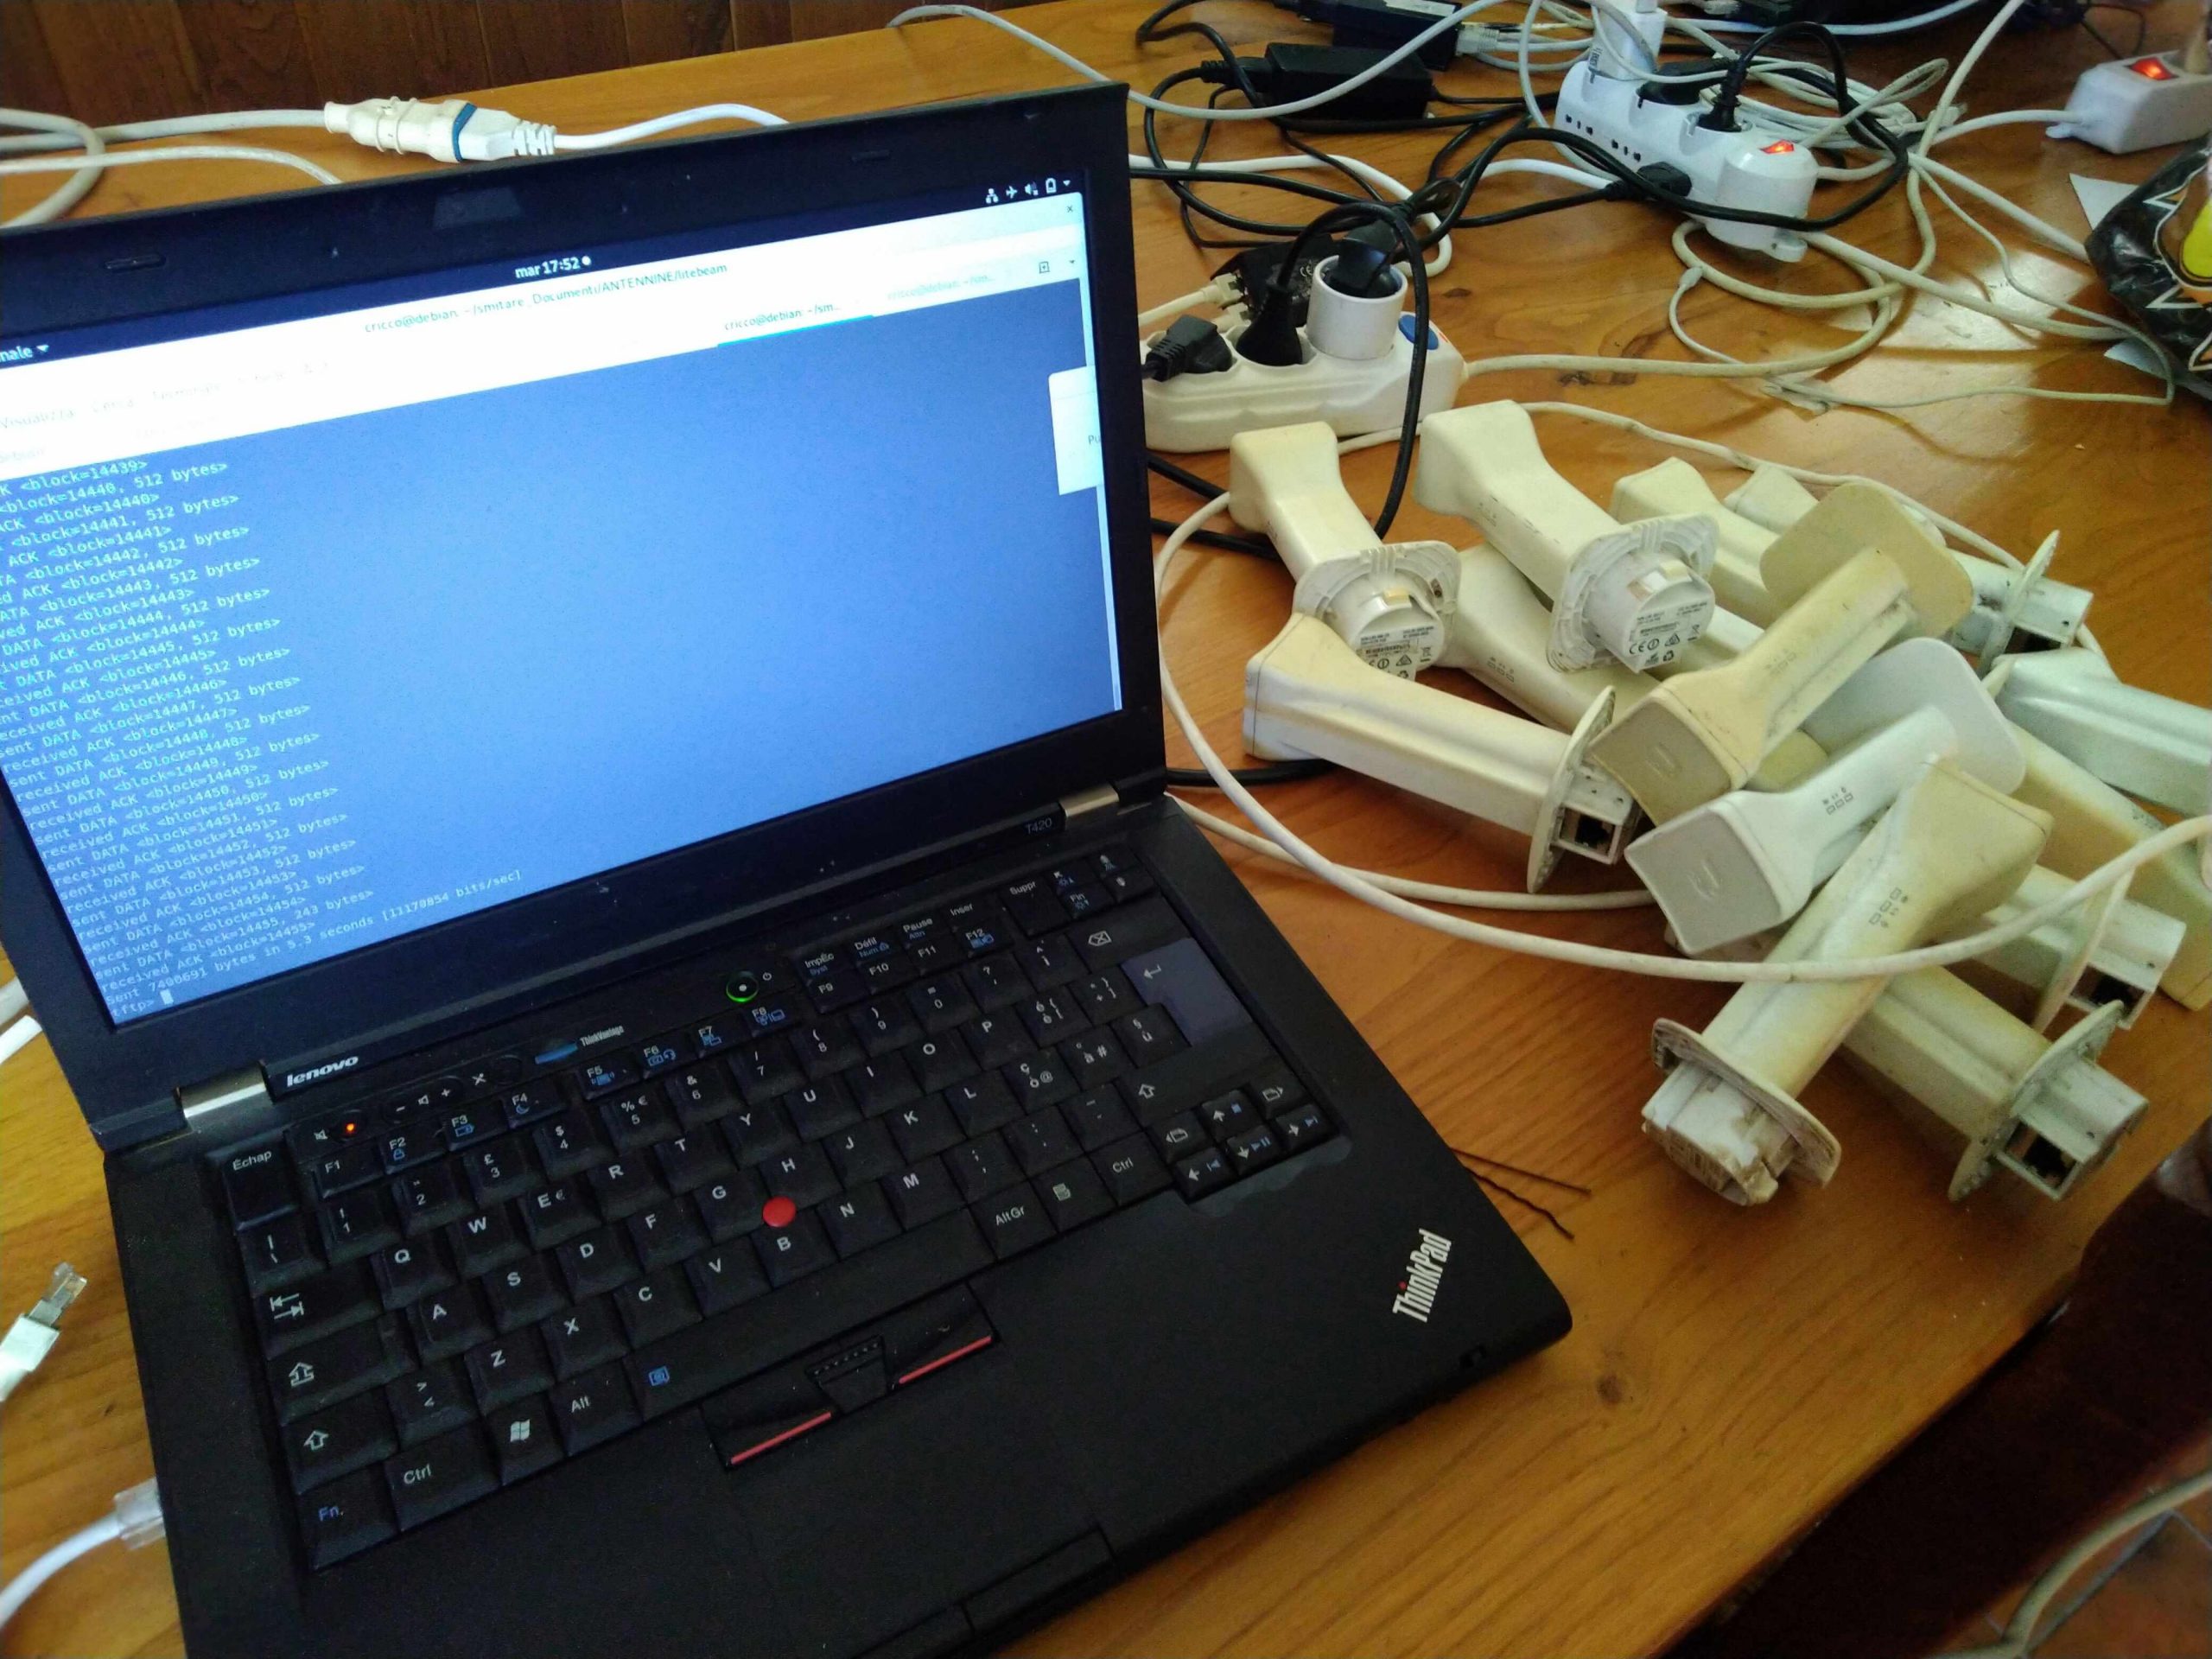
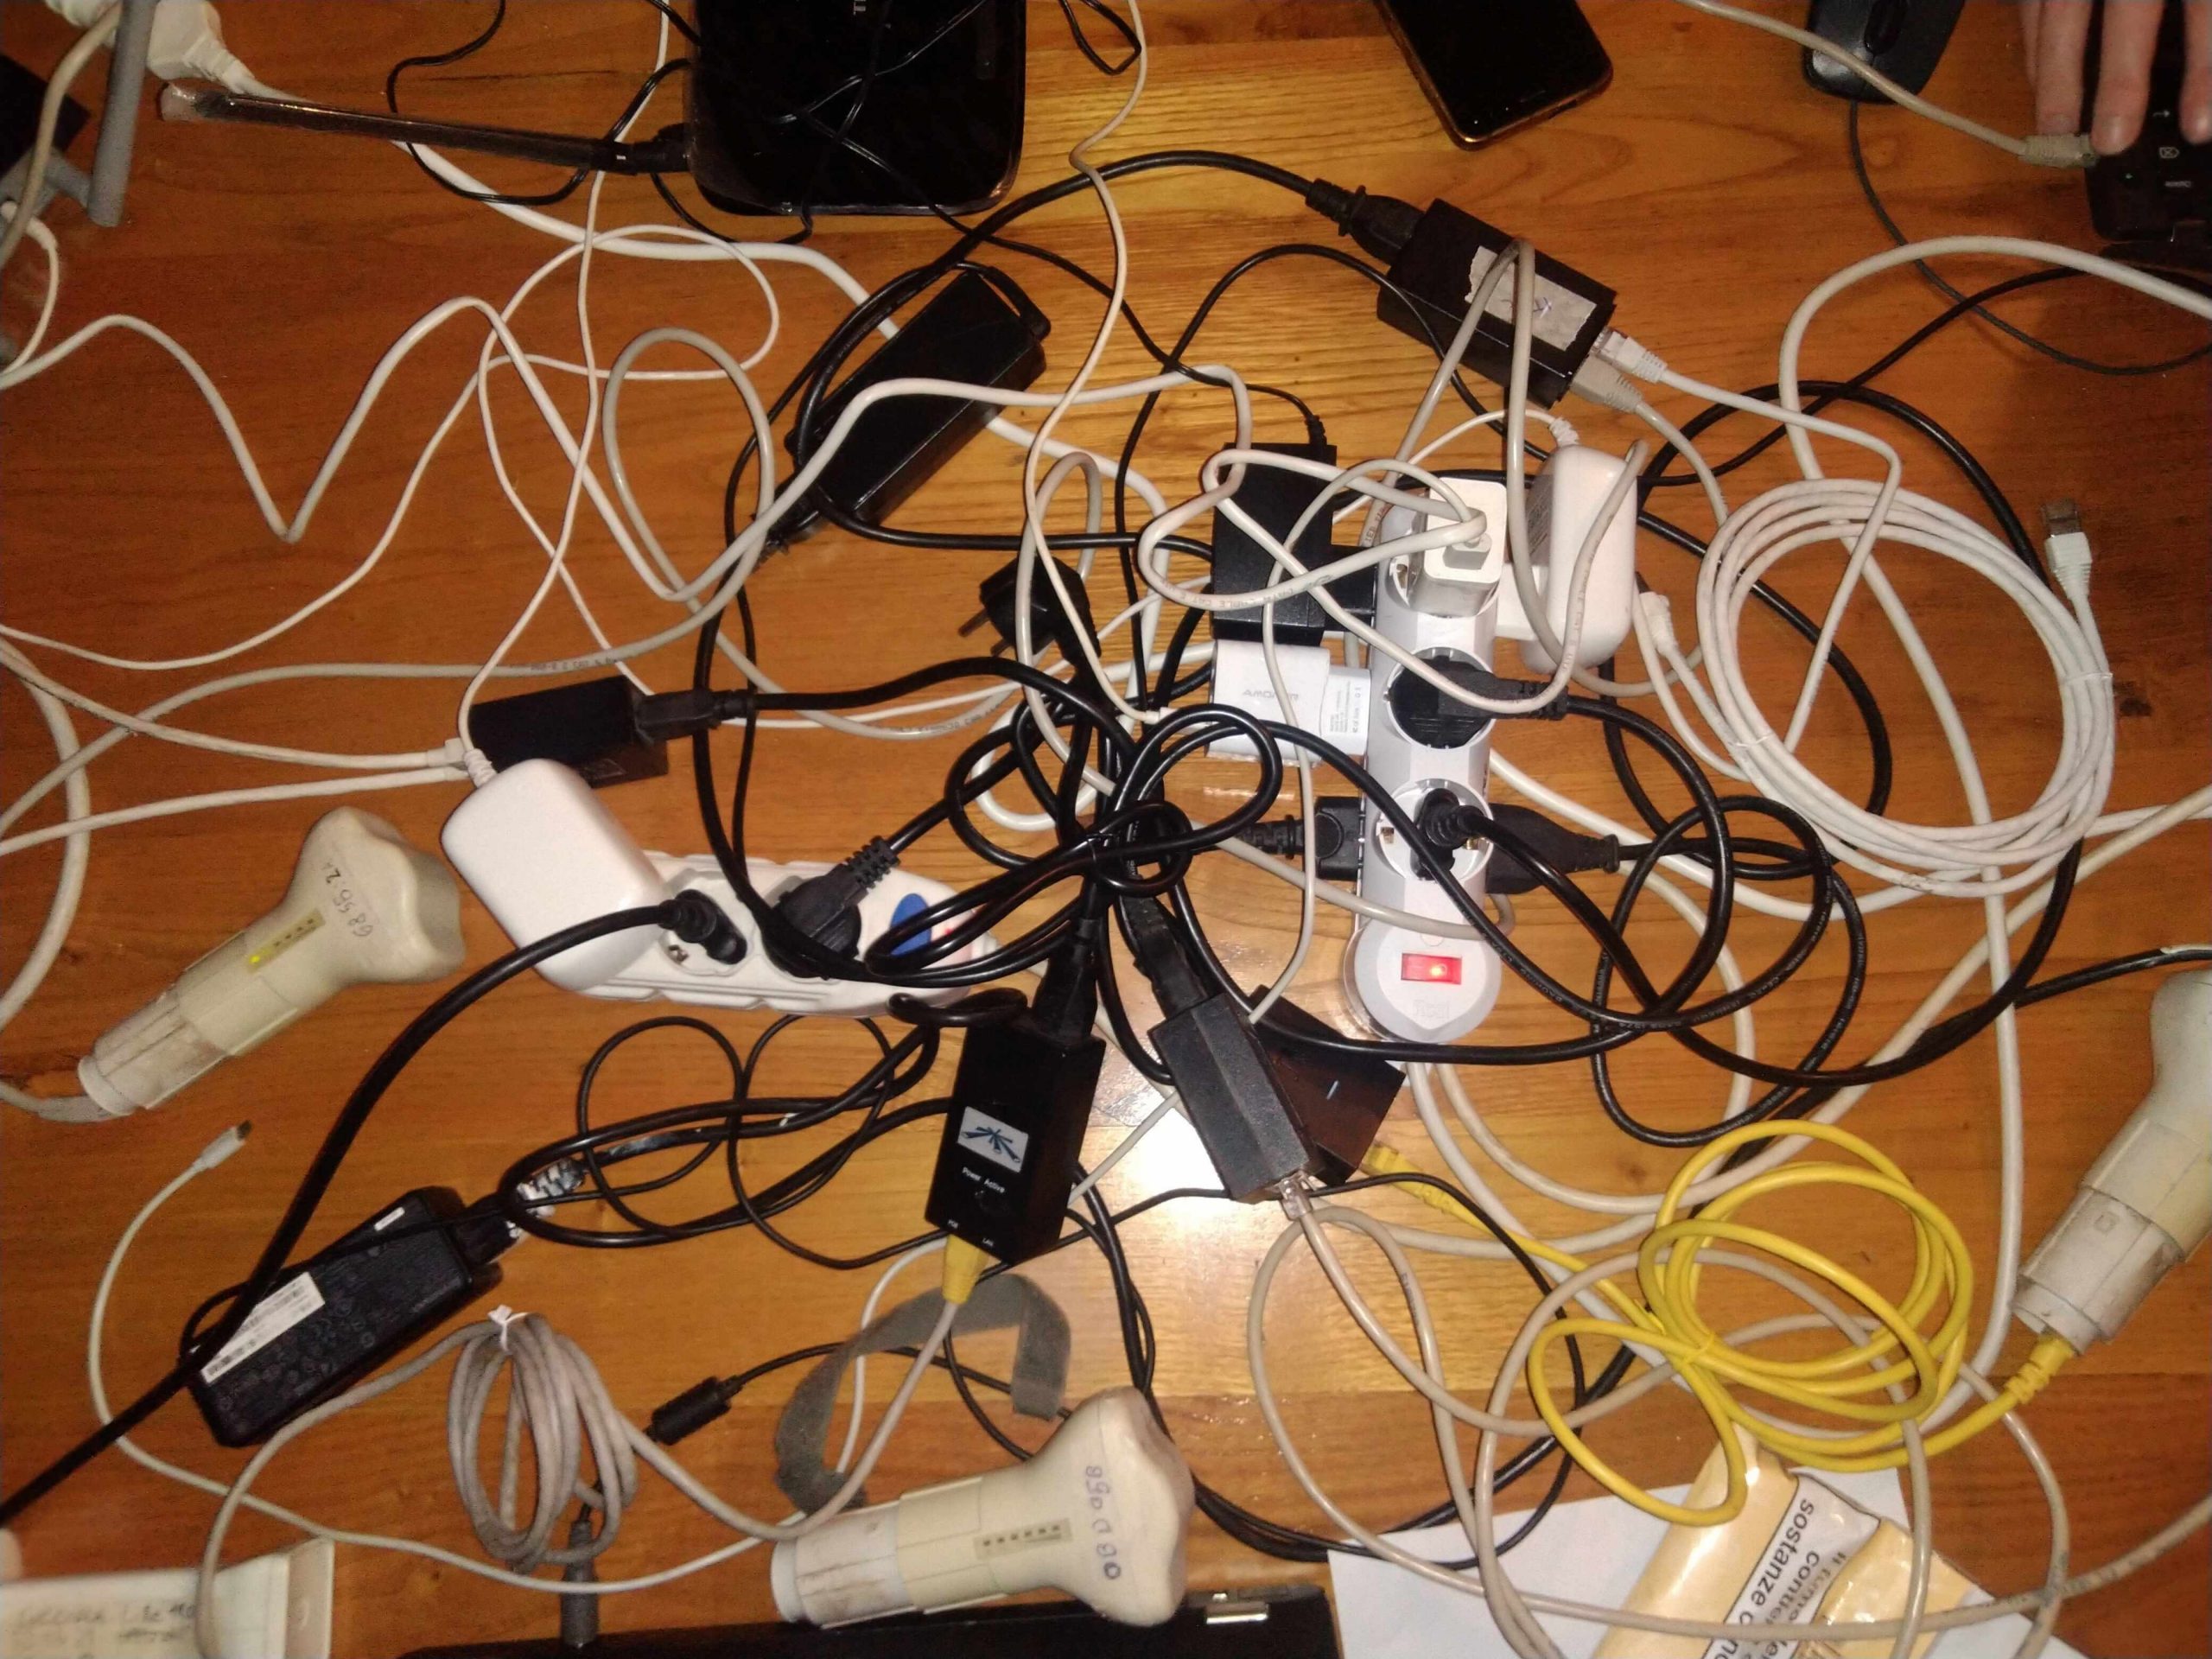
Ora che abbiamo un bel po di apparati di seconda mano, ecco che ci tocca capire quali sono affidabili e quali no.
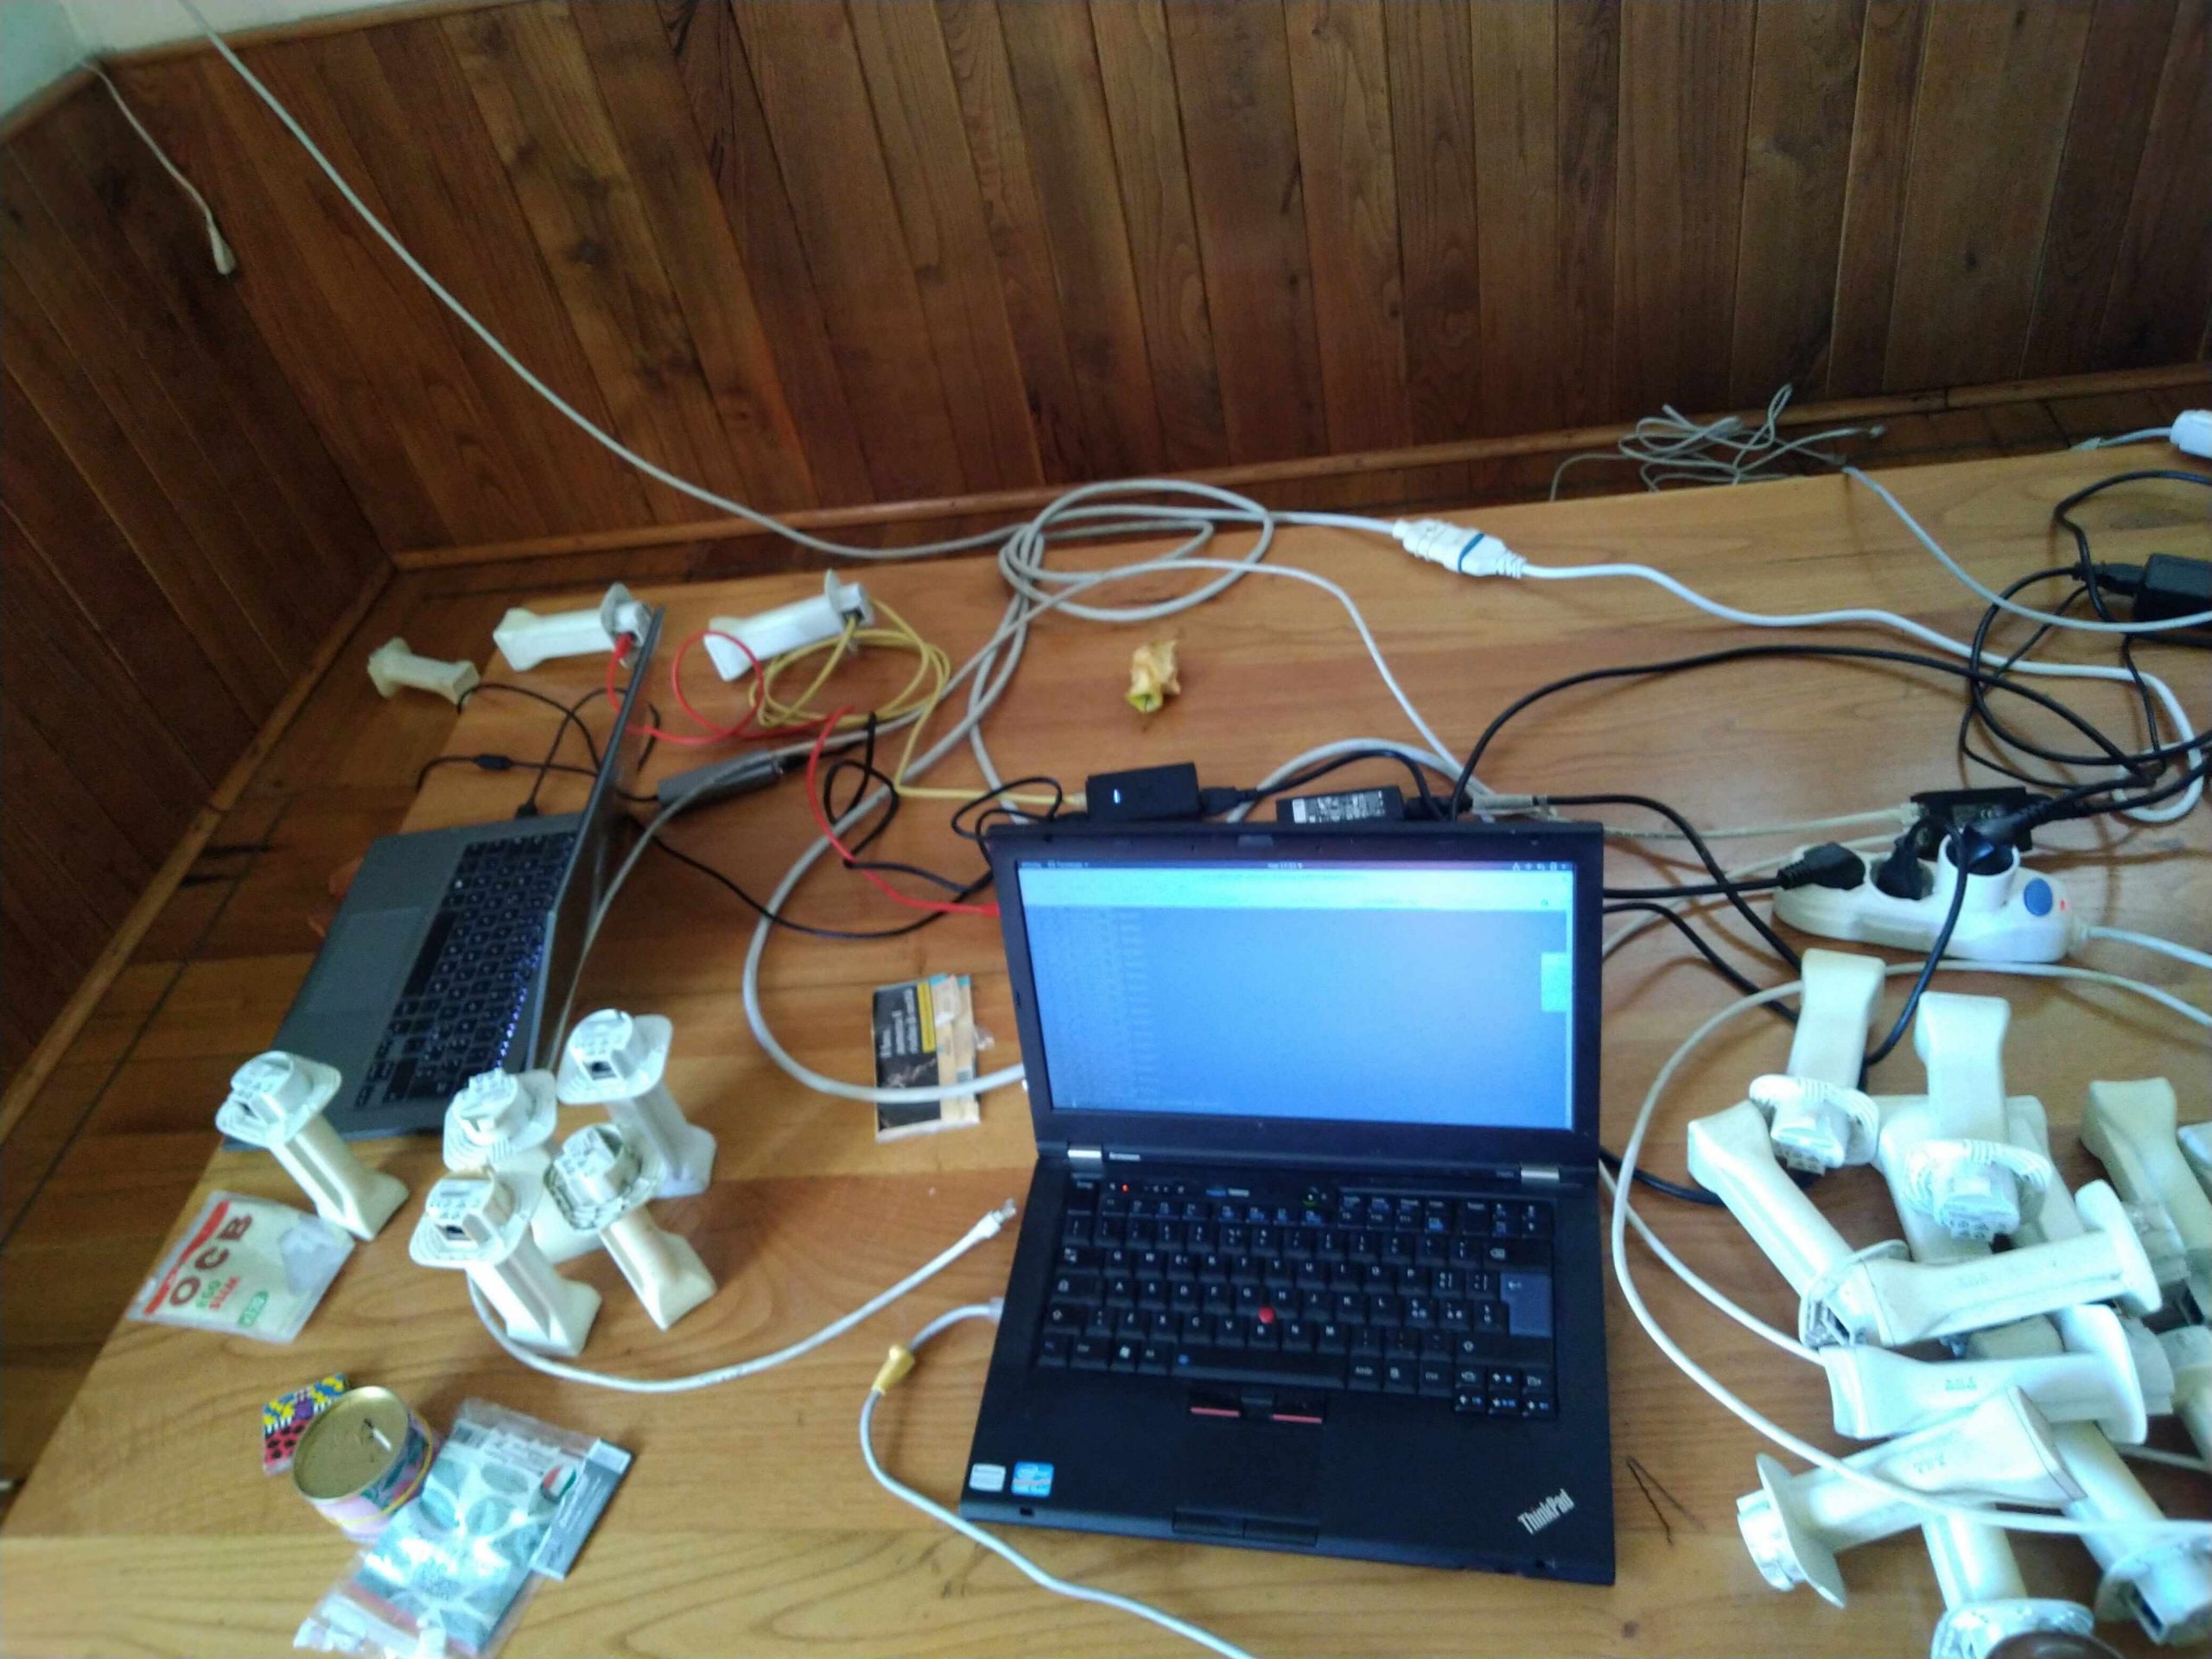
Conoscendo come gli oggetti elettrici ed elettronici spesso diano segnali di degradazione non appena accesi ma dopo una qualche ora di attività, abbiam pensato di mettere un sistema di monitoring su una raspberry per valutare in 5ore cadauna, se le antenne funzionano o no e quind dividerle in prima scelta, seconda scelta o da buttare nel RAEE.
Ecco come abbiamo fatto:
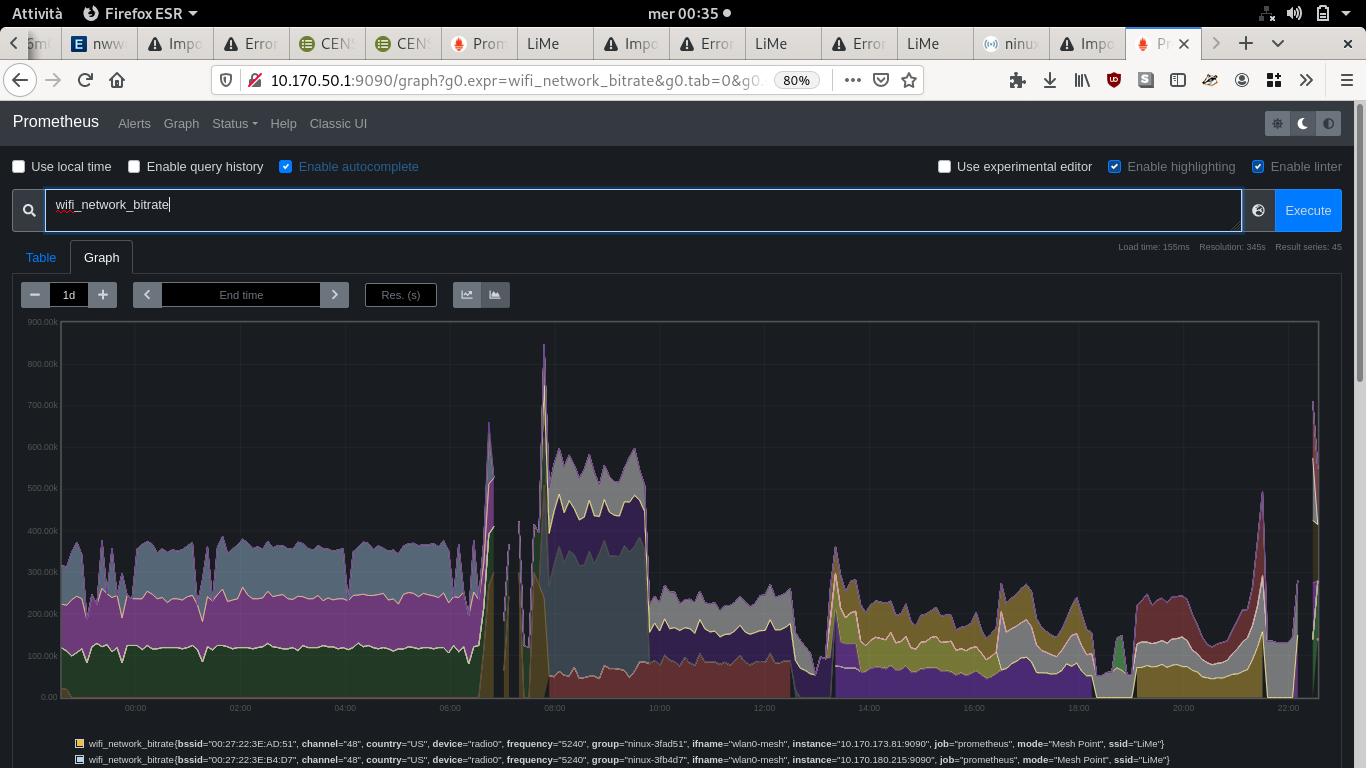
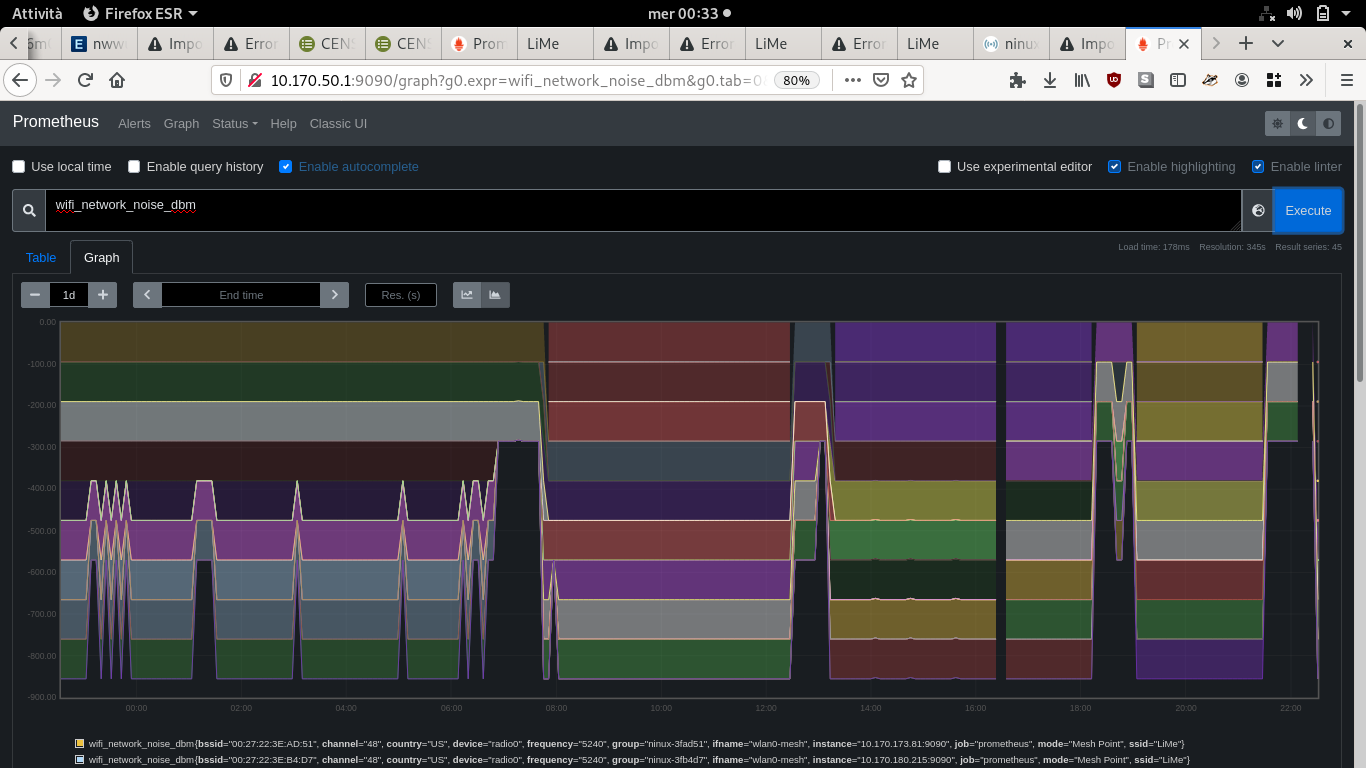
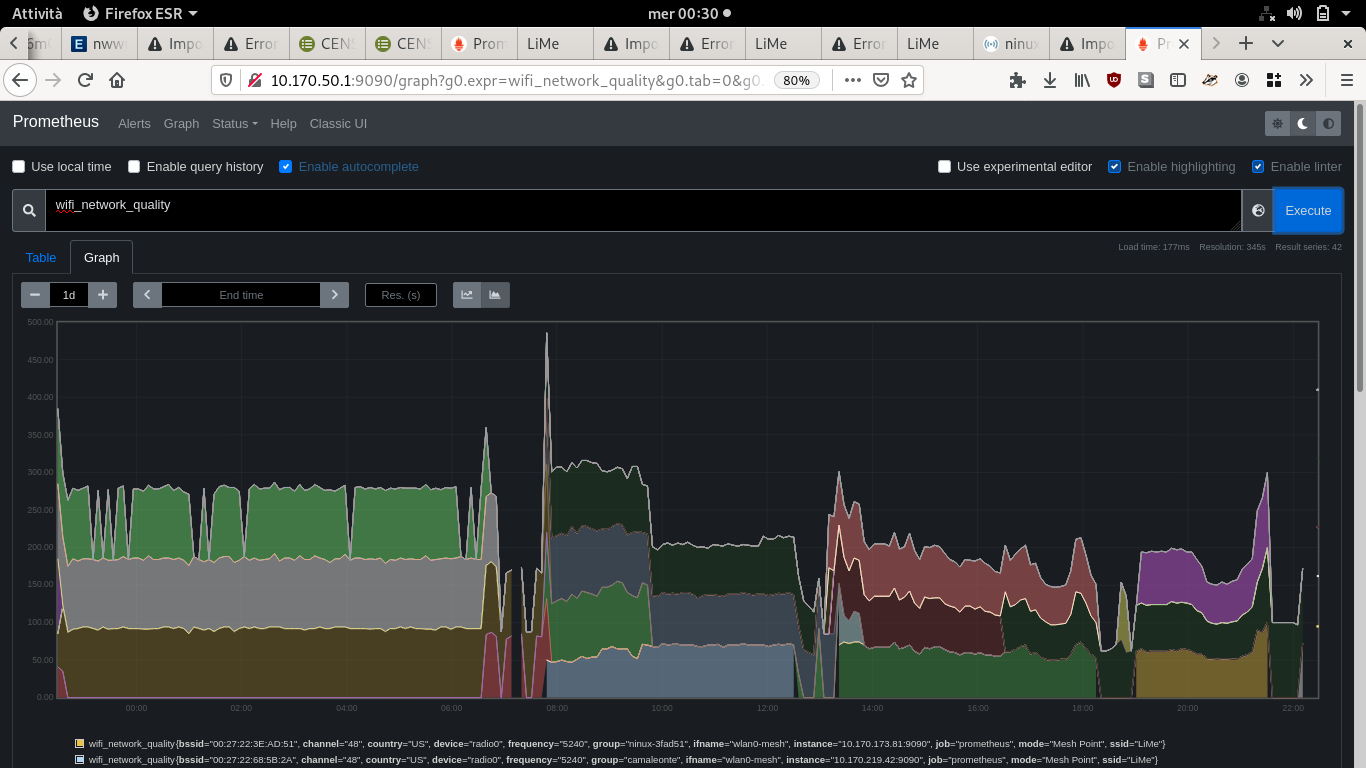
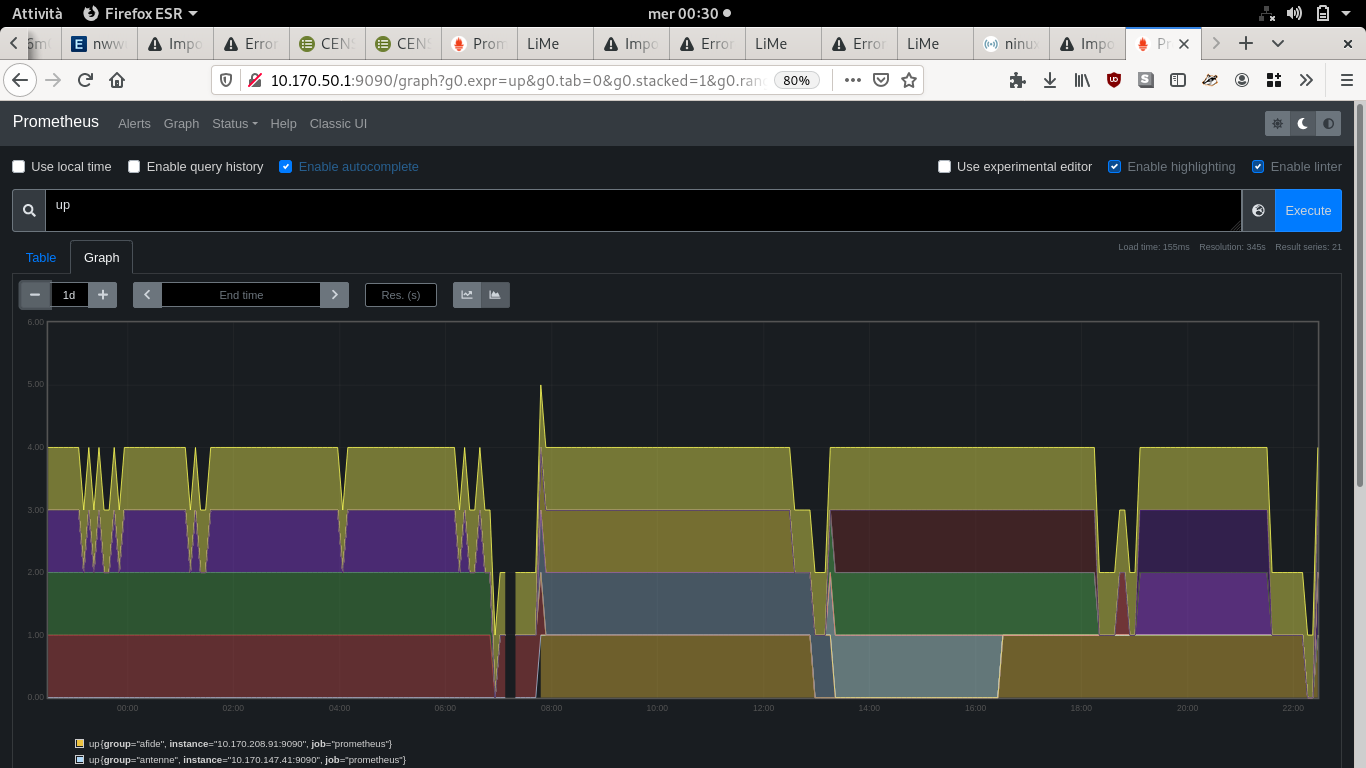
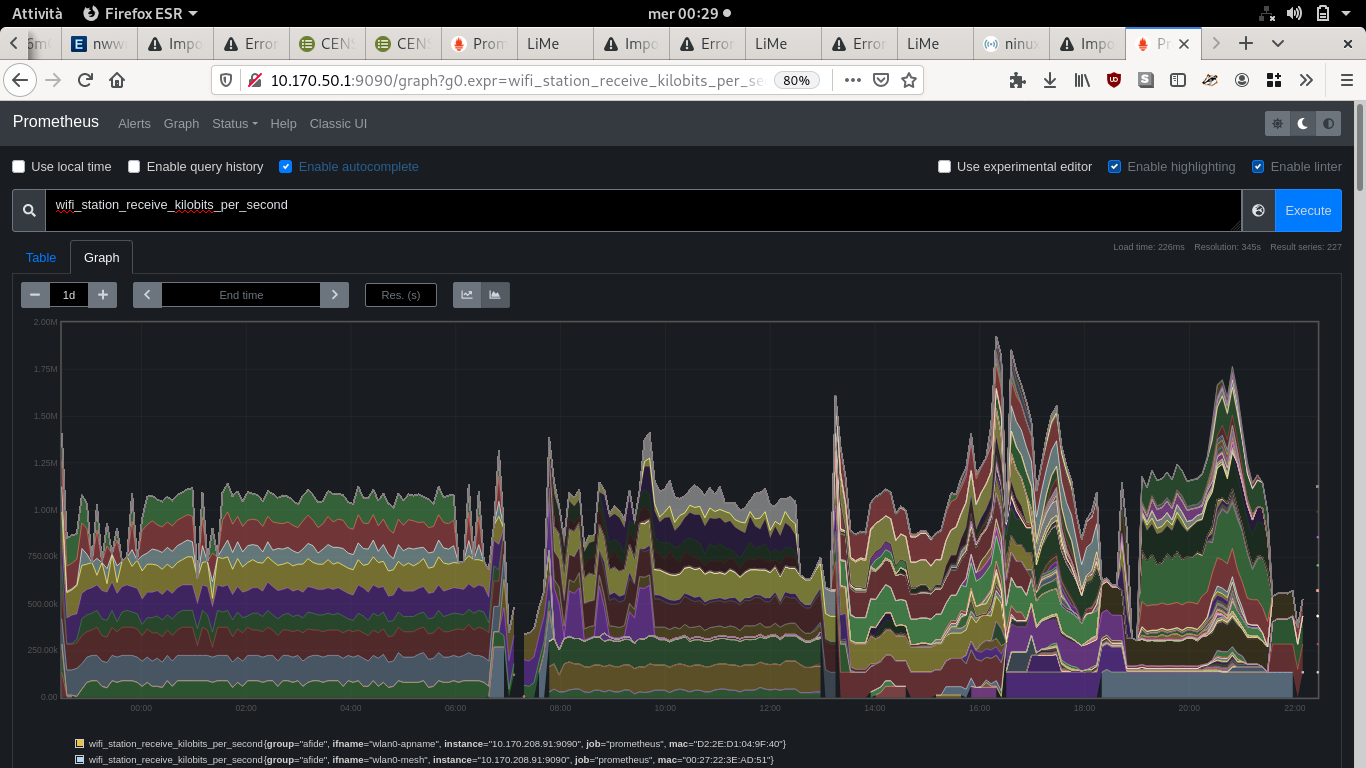
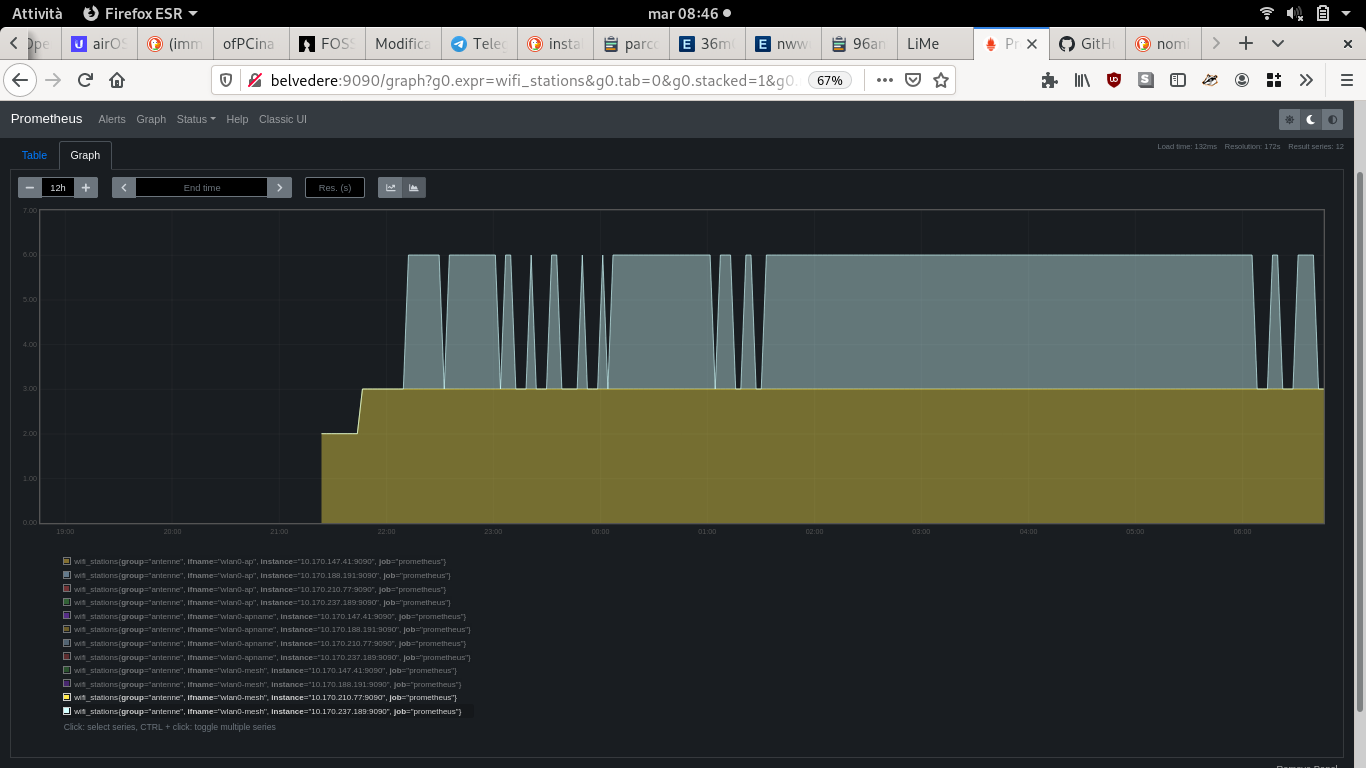
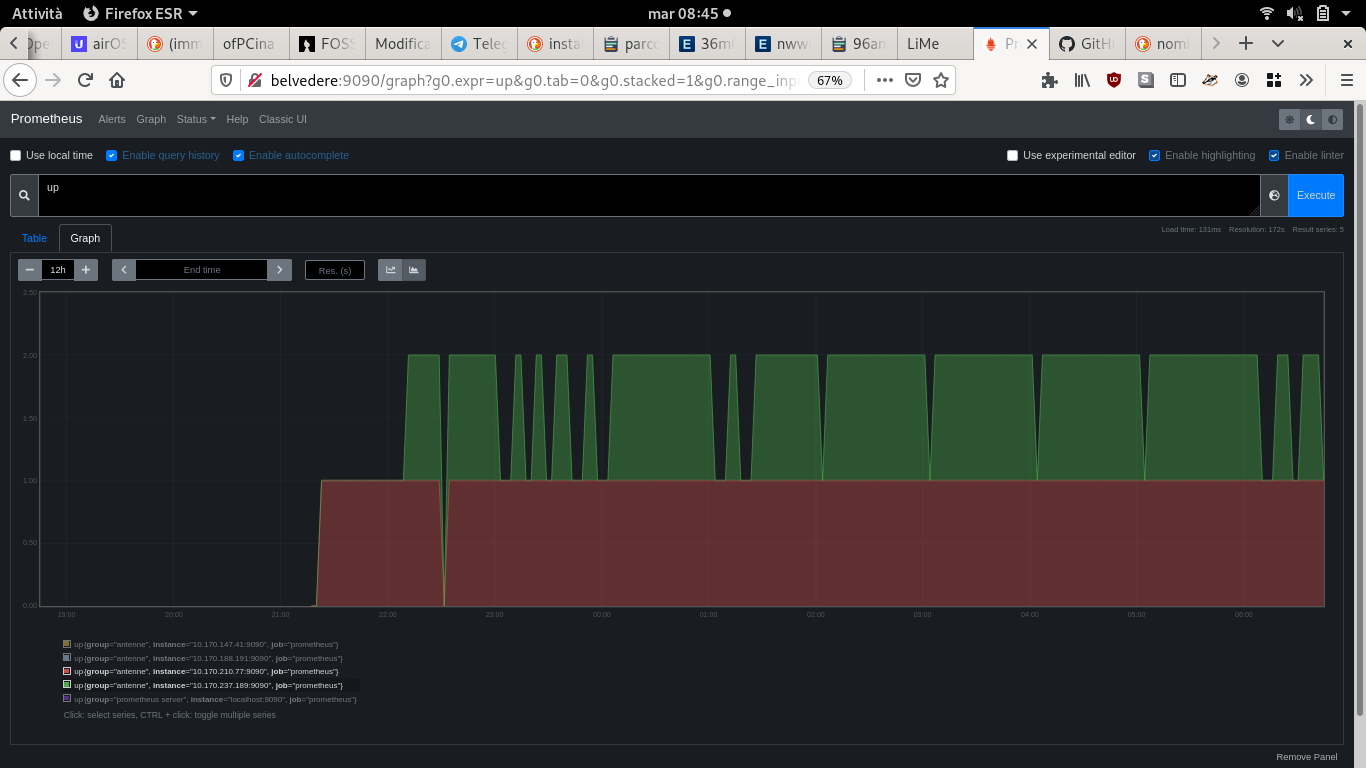
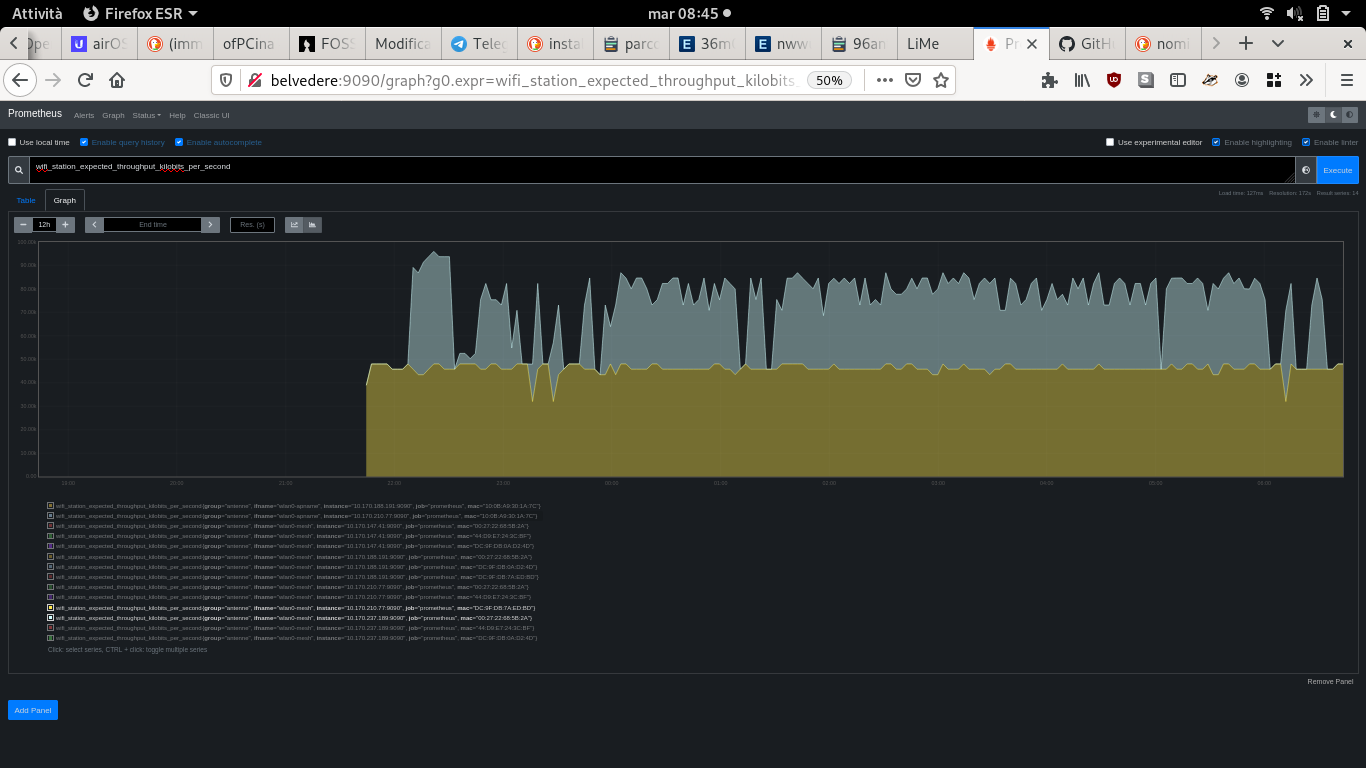
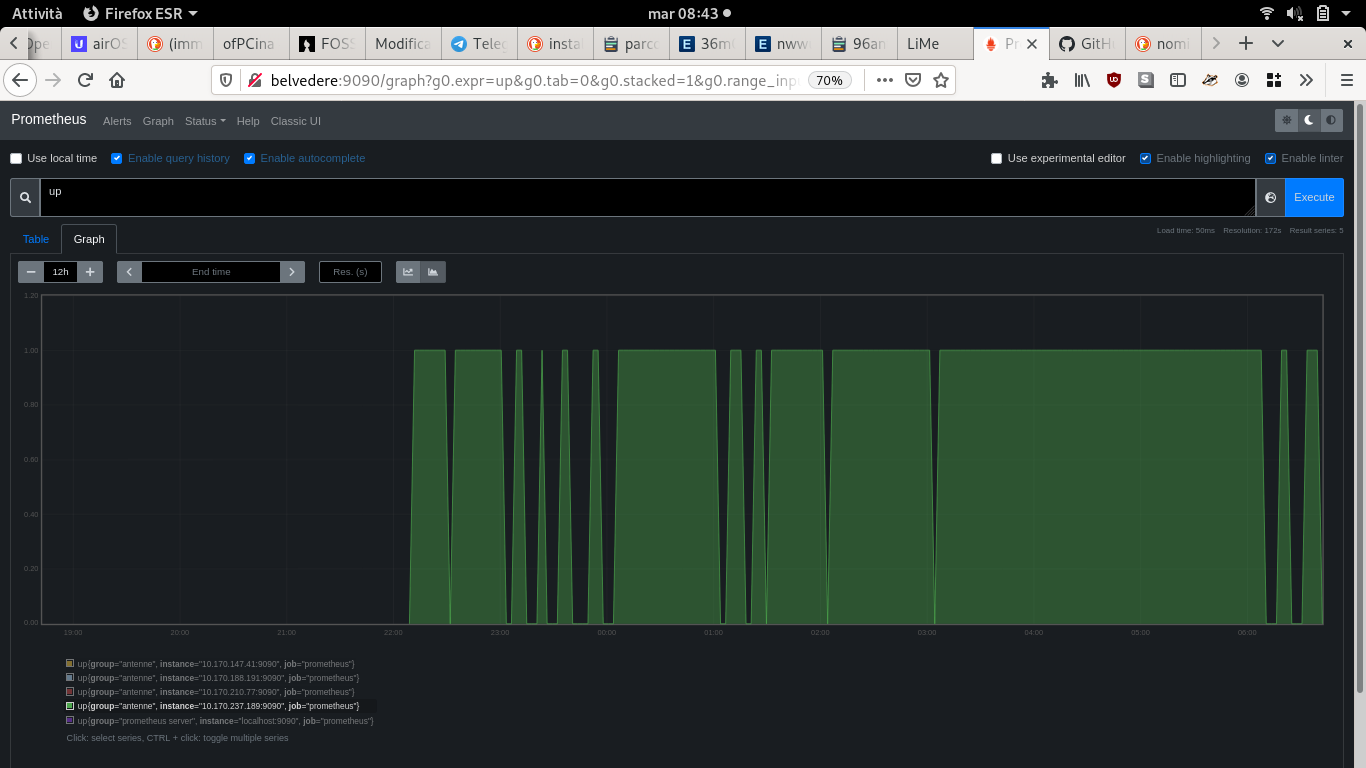
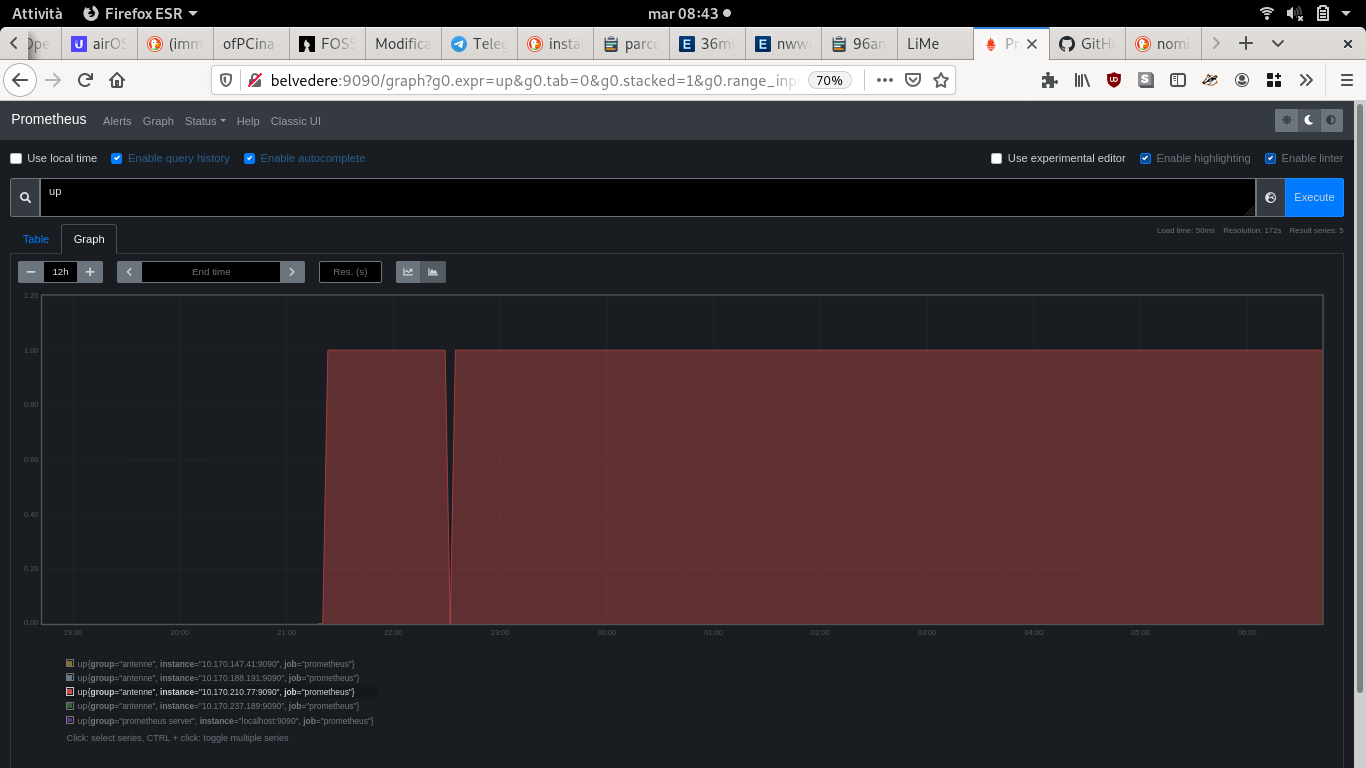
Obiettivo: raccogliere info da un collector di prometheus (monitoring)
Secondo obiettivo: testing di più antenne di seconda mano
con ssh al boot
$ sudo raspi–config
10.170.50.1/16 Rasberry Belvedere Note: 10.170.50.254 Ada nella rete di casa
Settato nome del raspberry:
$ sudo raspi–config
hostname, quando te lo chiede: belvedere
reboot
Settato fuso orario
sudo timedatectl –set-timezone Europe/Rome
Aggiunta route verso il gateway per risolvere problemi
sudo ip r add 10.170.0.1 dev wlan1 proto dhcp scope link src 10.170.30.196 metric 100 mtu 1350
Prometheus acceso all’avvio sul rasberry belvedere:
sudo systemctl enable prometheus.service
Testato: Sì
Prometheus acceso all’avvio sulle antenne:
All files in the files/ folder need to be copied over to the modem, and after doing that the prometheus node exporter service can be enabled by issuing the commands:
/etc/init.d/prometheus-node-exporter-lua enable
/etc/init.d/prometheus-node-exporter-lua start
The service is configured to listen by default on the ‘lan’ interface, if you need to change it you need to edit the file
/etc/config/prometheus-node-exporter-lua
and set the line
option listen_interface 'lan'
Testato: Si
Poi
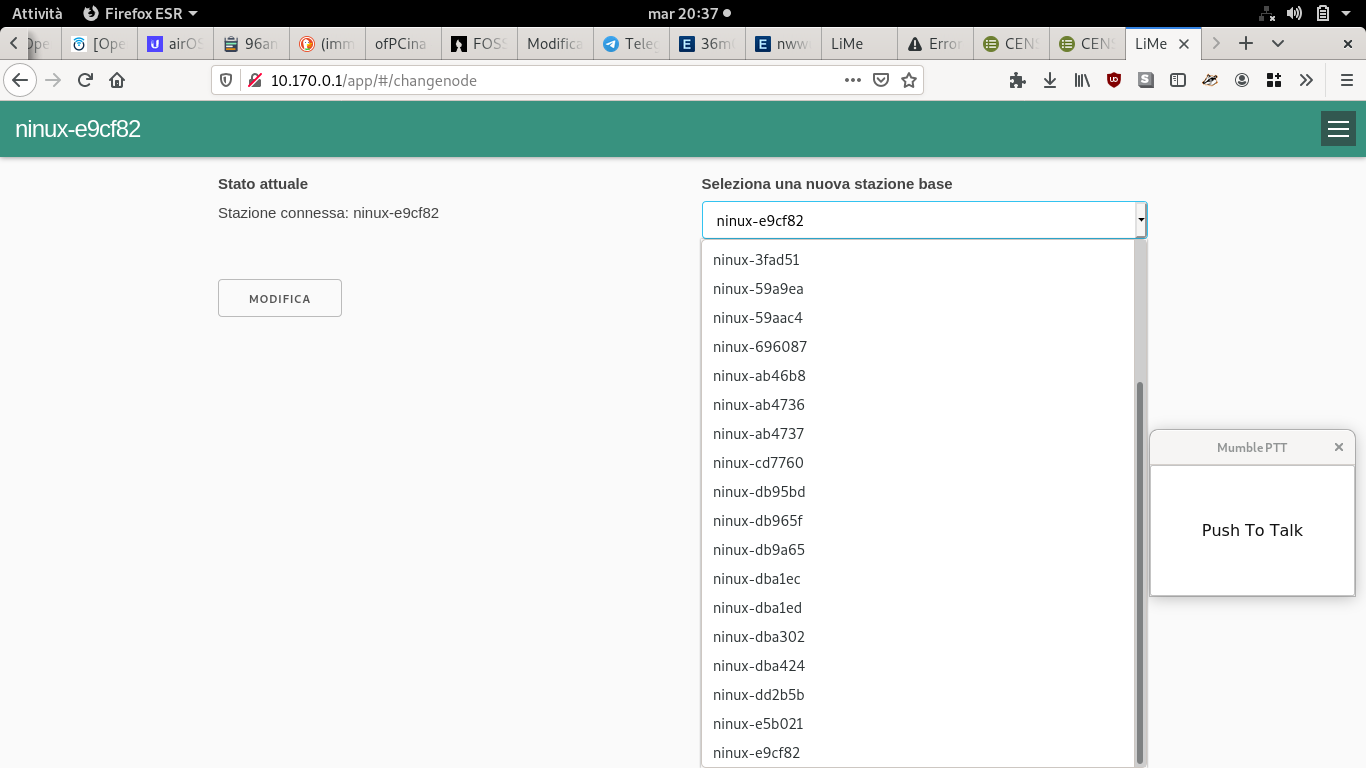
- cambiato nome all’hostname, es: blatta
- segnato il vecchio nome, l’ip eil nome nuovo sul calc
- messo lo static lease DHCP di belvedere:
- messo il cronjob – scheduled stask
3 30 * * * reboot
- aggiunto l’ip nelle configurazioni di prometheus /etc/prometheus/prometheus.yml
Dal belvedere.
- restart di prometheus dal rapberrypi belvedere:
systemctl restart prometheus.service
*prometheus alert:
*Alertmanager
installazione (un po a caso)
sudo cp alertmanager /usr/local/bin
sudo cp amtool /usr/local/bin
sudo chown prometheus:prometheus /usr/local/bin/amtool
sudo chown prometheus:prometheus /usr/local/bin/alertmanager
sudo cp alertmanager.yml /etc/prometheus/
sudo chown prometheus:prometheus /etc/prometheus/alertmanager.yml
proviamo un semplice:
Hardware alerts with node_exporter